Australian Crop Update – Week 10, 2025
2024-25 New Season - USD FOB Indications
NEW CROP PRICES ARE BASED ON TRACK BID/OFFER SPREAD PLUS ACCUMULATION & FOBBING COSTS AND ARE NOT FOB PRICE INDICATIONS.

New Crop - CFR Container Indications PMT
Please note that we are still able to support you with container quotes. However, with the current Red Sea situation, container lines are changing prices often and in some cases, not quoting. Similarly with Ocean Freight we are still working through the ramifications of recent developments on flows within the region – please bear with us.
Please contact Steven Foote on steven@basiscommodities.com for specific quotes that we can work on a spot basis with the supporting container freight.
Australian Grains Market Update
Grain prices in Australia eased again last week with the declines in global markets, although wheat basis strengthened. Prospects of rain encouraged some early week farmer selling but this faltered as priced declined. Sorghum prices were the big winner last week as trader bids climbed after China’s imposed retaliatory tariffs on US supplies. Canola prices tumbled with the sharp declines in Matif.
Against this backdrop Australian wheat exporters are struggling to get the volume of sales needed to achieve 24 million metric tonne (MMT) in wheat exports for the 2024/25 Season. This was evident in the January ABS export data that was released through the week. Australian wheat exports for Jan were 1.85MMT down from 2.147MMT in December which makes it unlikely it will even get to 10MMT by the half year stage of our marketing year.
Indonesia was the largest wheat destination in Jan with 296.7 thousand metric tonne (KMT) with the Philippines and Japan also taking more than 200KMT for the month. Wheat exports in Jan to China were disappointing at 5KMT. Australia’s Oct/Jan 24/25 wheat exports are at 5.7MMT which is down ~0.8MMT down on last year’s numbers. This is driven by China’s imports being down to just 177KMT – last year it was 1.4MMT at the same stage. It is worthy to note that there was 71.5KMT of wheat shipped to Iraq in Jan following the 41.5KMT in Dec. India also took 20KMT of wheat following the 18.3KMT in Dec.
January barley exports were strong at 1.094MMT. Close to 760KMT was shipped from Western Australia (WA) with Victoria (VIC), South Australia (SA) and New South Wales (NSW) chipping in for the remainder. The monthly barley shipments were evenly split between malting barley and feed barley. China took 705KMT of barley shipments in Jan. Thailand was the next largest with 101KMT and then Mexico with 96KMT. Saudi was next week 65KMT. Latin American malting barley exports for Jan totalled 126KMT.
Monthly canola exports continued at a strong pace with 788KMT shipped in Jan. Just under 500KMT was shipped to Europe and 192KMT to Pakistan.
The national wheat production estimate for the 2024/25 season now stands at 34.MMT, the third largest on record, up from 31.9MMT seen in December. Canola is now seen at 5.9MMT, up from 5.6MMT in the previous forecast, and the fourth-largest crop on record, while barley at 13.3MMT is up from 11.7MMT seen in December to make it the fifth-largest crop on record.
Australian Pulses Update:
Australia exported 395,428 metric tonnes (MT) of chickpeas, 201,554MT of lentils and 47MT of faba beans in Jan according to the latest data from the Australian Bureau of Statistics. Chickpeas destinations saw India receive 250,932MT, Pakistan on 72,786MT and Bangladesh on 55,336MT in January. Lentils export saw India receive 99,806MT, close to half the monthly total, Bangladesh 60,749MT and Sri Lanka on 21,847MT.
Export Stem & Ocean Freight Market Update:
It was a softer week on the Panamaxes, while Supramaxes held steady and Handysize gained ground. While we witnessed a marginal uptick in demand across most of the trading routes, the overall sentiment was soft as there is generally a sense of oversupply on tonnage.
In the Pacific we saw rates gently ease from Monday through to Friday. The Supramax sector saw a week of consolidation. The Handysize market continued the positive momentum in both basins with prompt tonnage continuing to be fixed. There was a notable shift in the Australian handy market with increased demand finally appearing for end March/early April dates causing a positive shift in sentiment for the first time in weeks.
Weekly shipping stem additions improved following a quiet couple of weeks. There was 573KMT of wheat put onto the stem in the past week. This included 272KMT from WA, 160KMT NSW and a welcome 86KMT in Qld and 55KMT in SA. There was also 228KMT of barley added to the stem, which was entirely WA as well as 60KMT of canola.
Australian Weather:
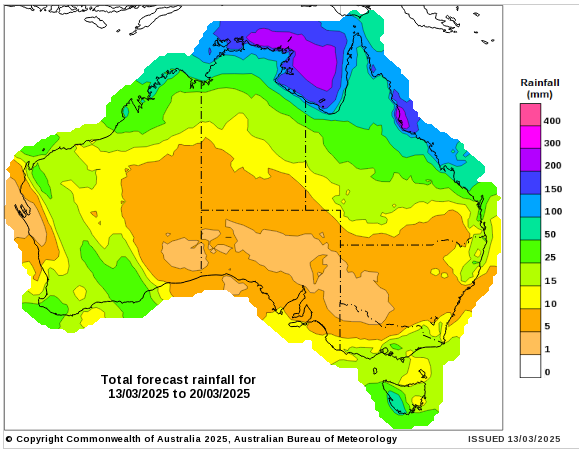
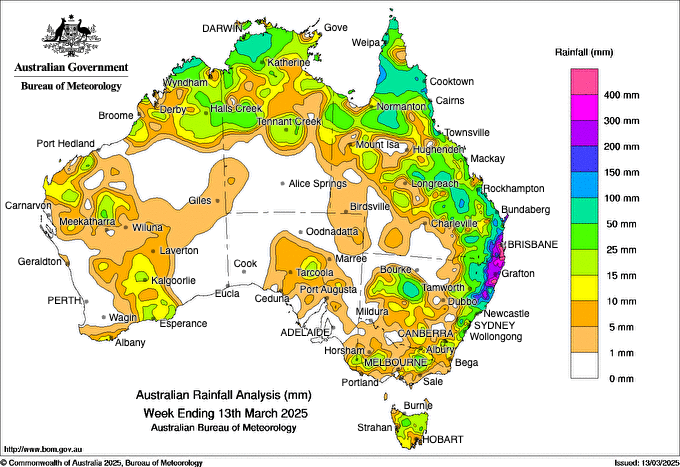
Southeast QLD and Northern NSW experienced significant rainfall over the past week as ex tropical cyclone Alfred made landfall on Friday. The slow moving system dumped record rainfall totals in coastal cities and as it moved west over the ranges.
NSW and SA look as though they will remain dry over the next week, with some of VIC and WA receiving between 10 to 25mm of welcomed rainfall.

8 day forecast to 20 March 2025
http://www.bom.gov.au/

Weekly rainfall to 13 March 2025
http://www.bom.gov.au/
AUD/USD Currency Update:
The AUD/USD pair struggled to recover as risk sentiment deteriorated with traders reacting to weaker-than-expected job growth and softer wage gains. Meanwhile, China’s trade balance data showed an unexpected drop in imports, raising concerns over slowing demand, which weighed further on the Australian dollar. China's imports unexpectedly shrank over the January-February period, while exports lost momentum, as escalating tariff pressures from the United States cast a shadow over the recovery in the world's second-largest economy.
Looking forward, more bursts of volatility should be anticipated as global economic and market ructions play out. But from a medium-term perspective we still think there is more upside than sustained downside potential for the AUD. A fair degree of negativity is already priced in with the AUD tracking ~3-4 cents below some ‘fair value’ models. In addition, the AUD has been sub-$0.63 less than ~3% of the time since 2015. Underlying dynamics that cushioned the AUD remain in place.
Share This Article
Other articles you may like
Sign Up
Enter your email address below to sign up to the Basis Commodities newsletter.


