

Australian Crop Update – Week 20, 2025
2024-25 New Season - USD FOB Indications
NEW CROP PRICES ARE BASED ON TRACK BID/OFFER SPREAD PLUS ACCUMULATION & FOBBING COSTS AND ARE NOT FOB PRICE INDICATIONS.
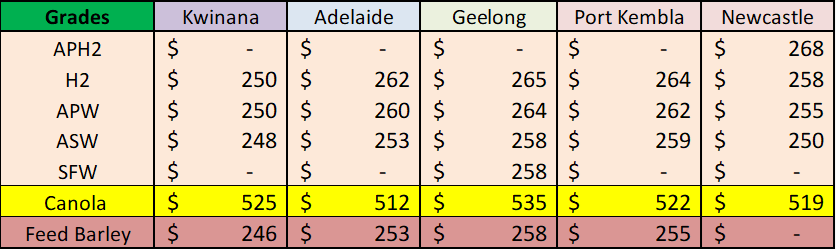
New Crop - CFR Container Indications PMT
Please note that we are still able to support you with container quotes. However, with the current Red Sea situation, container lines are changing prices often and in some cases, not quoting. Similarly with Ocean Freight we are still working through the ramifications of recent developments on flows within the region – please bear with us.
Please contact Steven Foote on steven@basiscommodities.com for specific quotes that we can work on a spot basis with the supporting container freight.
Australian Grains Market Update
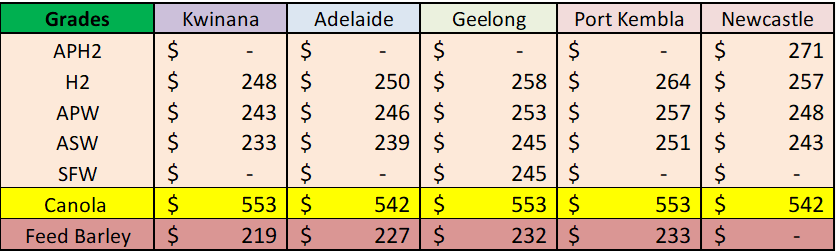
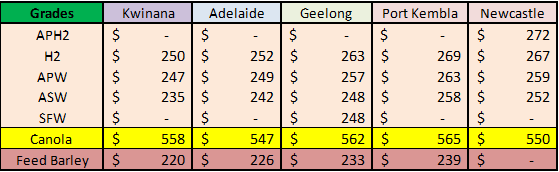
Australian grain prices drifted higher last week with the southeastern (SE) Australian markets leading the way. It’s purely a domestic push from the drought conditions in SE Australia with US wheat futures ending the week 4% lower. Reported wheat export sales to China for a Jun/Jul shipment appeared to offer support to wheat in the east and west last week. It was rumoured that Australian exporters sold 200-300 thousand metric tonne (KMT) of milling wheat late last week with traders confirming the sale of 275KMT on Friday on newswire.
The bigger factor driving Australian markets last week was the ongoing dry weather in SE Australia and the impact this is having on domestic prices. Grain markets across SE Australia are feeling increasingly pressured by drought conditions. The current conditions are different to many other droughts as its isolated to SE Australia and currently it is just an old crop problem for now. There is still plenty of time to plant crops in the SE and much of this is already dry planted. New crop markets are unlikely to become overly concerned for another four to six weeks.
Australian Export Statistics Update:
Australia exported 2,118,261 metric tonnes (MT) of wheat in March according to the latest data from the Australian Bureau of Statistics. This is up 0.4 percent from the 2,109,483MT shipped in February, but down 17pc from the 2,566,965MT exported in March 2024. In containerised sales, Vietnam on 45,195MT followed by Malaysia on 30,087MT, Thailand on 28,676MT and Indonesia on 28,649MT were the four biggest markets for March-shipped wheat. On bulk, Indonesia on 339,516MT, Thailand on 293,581MT, and China on 278,49MT were the three biggest markets, with the volume to China the largest in many months.
Export Stem & Ocean Freight Market Update:
Last week saw only a few vessel additions to the shipping stem with 378KMT of wheat added which is the smallest in five weeks. This included 154KMT in Western Australia (WA) (mostly Kwinana), 110KMT in New South Wales (NSW) (Quattro) as well as single cargoes in Victoria (VIC) and South Australia (SA). There was also 30KMT of barley put on the stem in Albany WA.
After a sluggish start, activity gained momentum across all sectors as the week progressed in the freight market. This has brought a more positive tone to the market as regional holidays have mostly come to an end.
The Atlantic overall performed better in terms of rates and activity given the Pacific was largely hampered by the holidays. The Atlantic Panamaxes witnessed steady support from grain runs ex NC South America which helped push rates in the North. Down south, EC South America was noticeably quieter than previous weeks which had the usual flow on effect into the Indian/SE Asia market with rates sliding. In the Supra/Ultra sector, the Altantic was busy from USG and EC South America but patchy from CONT/Med. West Africa tonnage was being pulled by ECSA and SAFR giving owners plenty of options to consider. The PG/India sprung to life after being muted for the last few months. Supra/Ultras are seeing in the mid/high teens for trips multiple directions. The Pacific market was generally quiet with a lack of Indo coal demand in the market and Aussie/Nopac being subdued as well. The Handysize has remained flat across both basin as the market appears to have found its equilibrium in the short term.
Australian Weather:
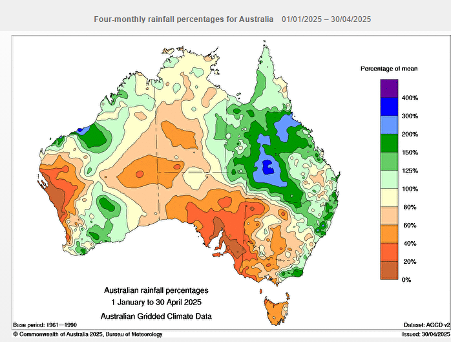
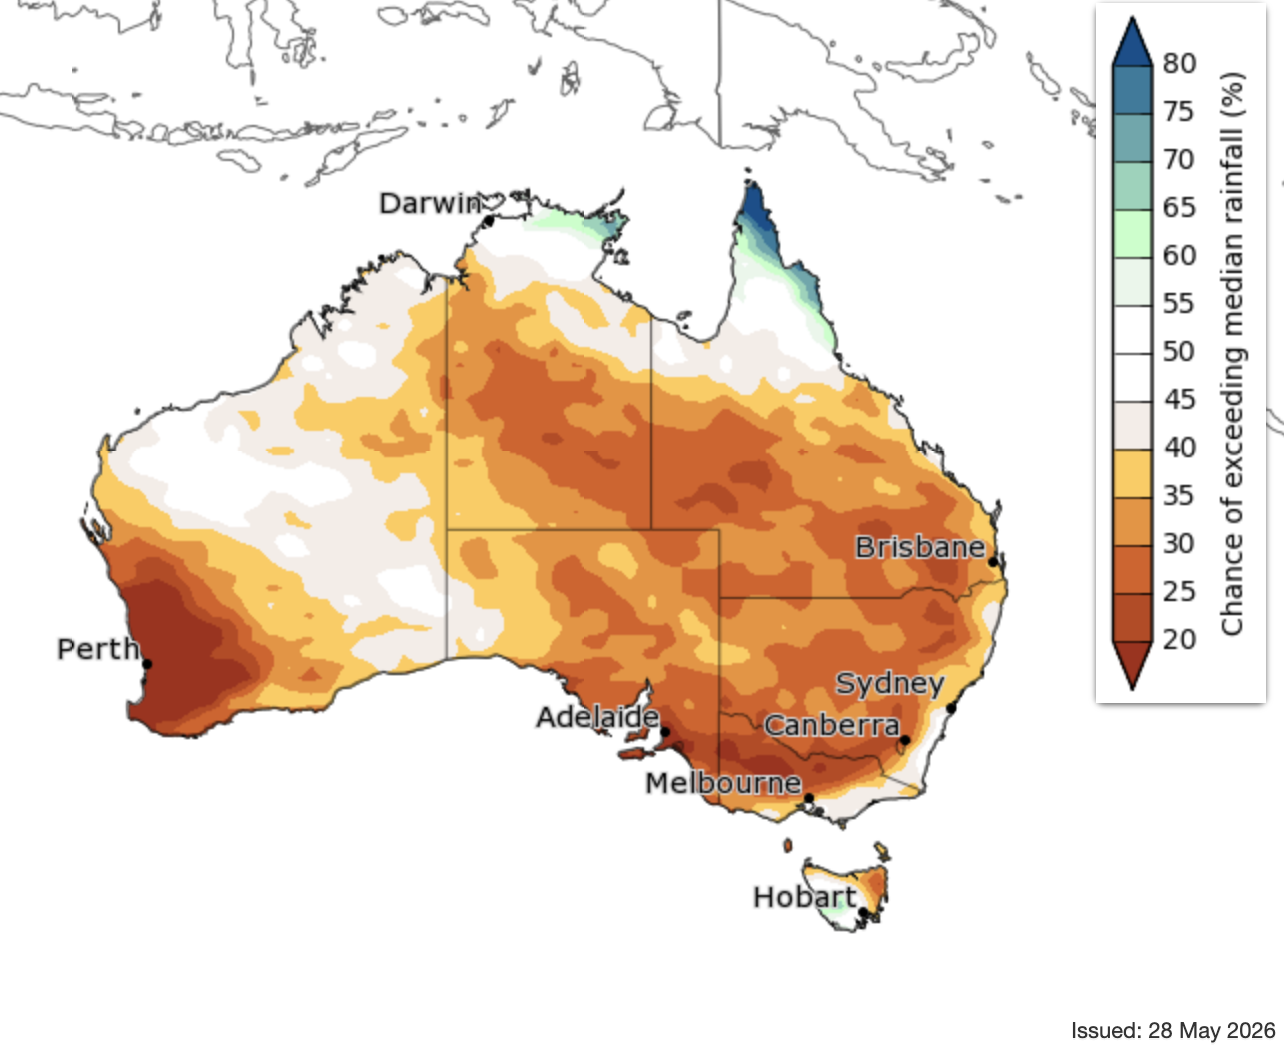
Parts of SA, VIC and Tasmania (TAS) have endured their driest start to a year on record as a lack of early Autumn rain worsened drought conditions in parts of all three states. High pressure systems have been dominating the weather patterns near southern Australia in recent months. These stubborn areas of high pressure have prevented any substantial rainfall from reaching large areas of SA, VIC and TAS since the start of 2025. The map below shows the rain that fell across Australia in the first four months of 2025 represented as a percentage of the long-term average. The brown shading shows where rainfall was less than 20 percent of the long-term average for the January to April period. Dry weather is also a concern for the Geraldton zone in WA. Forecasts remain dry for at least the next 10 days.
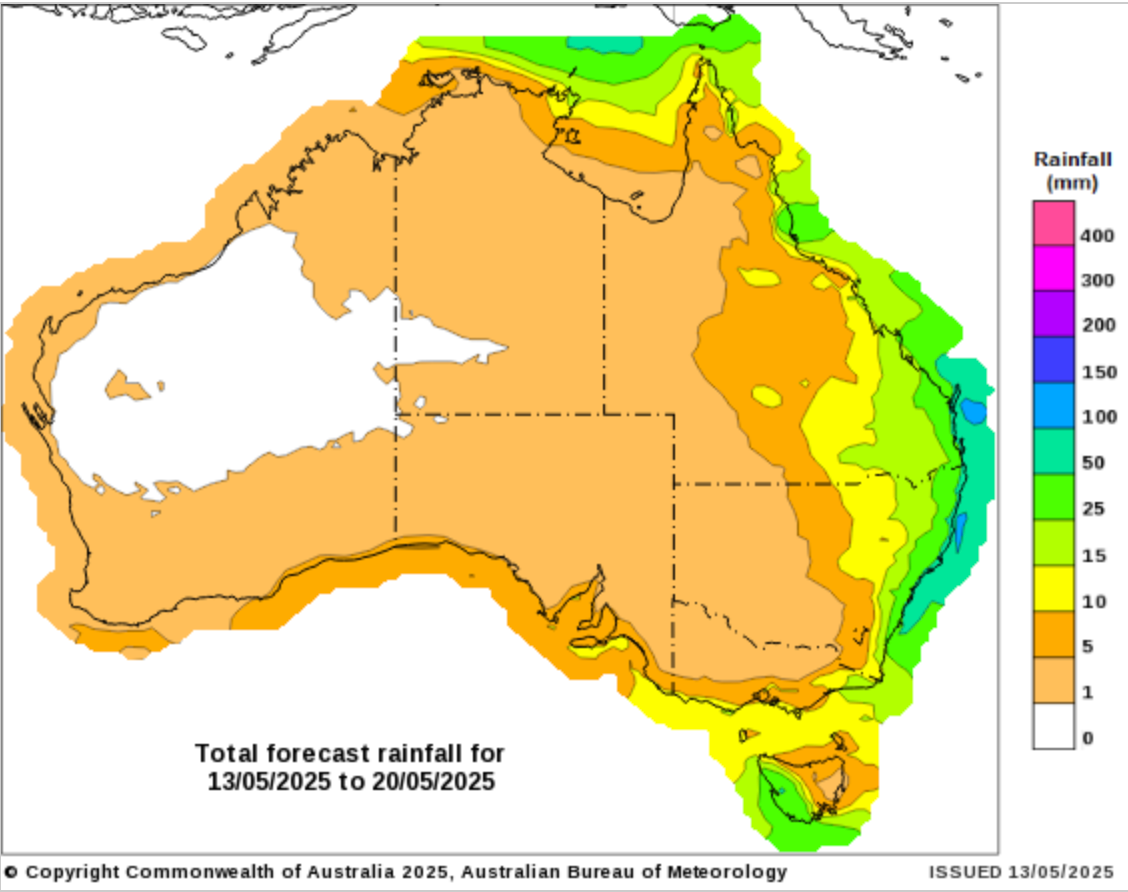
8 day forecast to 20 May 2025
http://www.bom.gov.au/
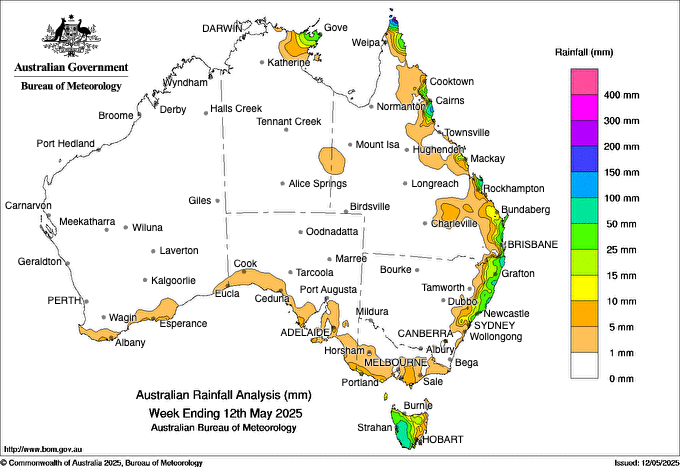
Weekly rainfall to 12 May 2025
http://www.bom.gov.au/
AUD/USD Currency Update:
The Australian dollar closed last week at similar levels to the previous with much volatility during trade sessions. The market ended at .6413 on Friday after pressuring through .6500’s and falling to the mid .6300’s throughout the week. Expectations are that the new normal is volatility with the world markets reacting to the ongoing tariff implications and global instability. Bank forecasts are still anticipating that the AUD/USD pairing will firm in Q4 of 2025 and push towards .7000 cents with 2 Federal interest rate cuts before the end of the year.
Share This Article
Other articles you may like
Sign Up
Enter your email address below to sign up to the Basis Commodities newsletter.